
What is a KPI?
A key performance indicator (KPI) is a measurable value that demonstrates how effectively a company is achieves key business objectives. Organizations use KPIs to evaluate their progress and success at reaching targets.
In simple terms, a KPI is a goal you work towards achieving. For the sake of simplicity, let's look at this example: you own oranges stand, and to be profitable this month, you must sell 1,000 oranges.
So, you set your KPI: sell 1,000 oranges this month. Whether that's 250 oranges per week or you sell 1,000 in the first three days, your KPI is to reach that 1k mark. When it's the second week of September, and you've sold 550 oranges, you can see your KPI and know that you're on track to achieve your goal.

What is the definition of key performance indicators (KPI)?
The definition of a KPI, or a key performance indicator, is "a measurable value used to evaluate how successful a person or organization is at reaching a target."
In businesses, key performance indicators can either be high-level or drill down to a specific department or individual. High-level KPIs typically look at the performance of your business as a whole, like achieving $1M in annual recurring revenue this fiscal year. When you drill down into specific processes to departments, teams, or individuals, those are low-level KPIs.
What's the difference between a KPI and a metric?
The difference between a KPI and a metric is nuanced. It is worth noting, though that despite their subtle differences, you often need one to have the other.
Here's a side-by-side comparison of a KPI and a metrics
How to set KPIs for your team and company
Now that we have the definition of a KPI let's take a look at the basics of setting KPIs.
while you can take inspiration from industry-recognized KPIs, your set should be unique to your business and goals. It's important to remember that KPIs are a form of communication. When you write a KPI, keep in mind the basic rules of communication: briefly expressed, and relevant information is the most effective.
Let's look at an example of a bad KPI versus a good KPI.
Here's a bad KPI: Make a lot of money this year.
Why is this a bad KPI: To start, it's incredibly vague. Is "a lot of money" $10K or $1M? There's no definitive action that you can tie to your KPI if you don't have a specific amount you're working towards, there's no 'goal post'(i.e. defined amount) to know you've hit your target, and there's no metric to attribute to it so you can track your progress.
On the flip side, here's an example of a good KPI: increase monthly recurring revenue by $25K this month.
Why is this a good KPI? It's specific in more ways than one: it outlines the dollar amount and the timeframe in which you hope to achieve it. With a detailed KPI like this, you have an associated metric Monthly Recurring Revenue (MRR) that you can track against your progress and hone in on what specific action(s) you're going to take to achieve your KPI, like going after expansion MRR for existing customers.
To develop a strategy for writing KPIs, start with the basics: understand your organization's objectives, how you plan to achieve them, and who can act on the information. As you iterate and develop, you will better understand which business processes can be on a KPI dashboard and who you should share that dashboard with.
How to define KPIs?
It can be easy to confuse KPIs with business metrics. KPIs, or key performance indicators, should relate to a specific business outcome with a performance measure.
Let’s look at an example of how to set a KPI:
Your business objective is to increase your monthly recurring revenue so, your team sets a sales growth KPI.
Here's how you might define the KPI:

What are the best KPIs?
We've said it a lot throughout this article: your KPIs should directly tie into your organizational goals and mission. Get started building your KPI dashboard with these metrics.
What are the benefits of using KPI ?
KPIs serve as a roadmap to help you and your organization reach your goals. And the pursuit of your goals depends on focused and consistent delivery of results. When you track your KPIs using a dashboard and reporting tool, there are numerous benefits, including:
KPIs that engage employees
We've already mentioned it, but it's worth noting one more time: KPIs unify employees to work towards a common goal.
Employee engagement, a topic that many organizations struggle with, can directly impact your bottom line. But KPIs can help. KPIs, whether individual or organizational is a helpful mechanism to measure performance, which has a direct tie to employee engagement.
Organizations with an engaged workforce see higher customer engagement, productivity, and 21% higher profitability.
On the flip side, disengaged employees cite the same issues: poor communication about strategy between management and individual contributors. KPIs help solves this problem.
KPIs connect your purpose and your culture
Your KPIs should be connected to your organization's mission. “Making money” isn't a mission, and it's not something that employees will connect with on a deeper level, your purpose should encourage employees to show up to work with a renewed sense of excitement every day. There should be a direct link between your mission and KPIs so that employees feel like their work is purposeful in achieving both. Remove ambiguity: ensure your KPIs work towards your end goal and employees clearly understand how and why they're working towards that.
KPIs make everyone accountable for performance
Traditionally, individual performance management frameworks are about setting objectives, measuring performance, and managing related activities. So why not incorporate KPIs into performance management, too?
Performance KPIs will help employees measure their impact and how their daily activities, arguably the foundation of their role, play into the success of larger organizational goals. KPIs set everyone off in the same direction, making everyone a happy contributor to your success.
Best Executive KPIs

Using SMART framework to define company KPIs
You might ask yourself: “How do I measure my company KPIs?” One way to measure the performance of your KPIs is by using the SMART framework.
What is the SMART framework?
Specific, Measure, Attainable, Relevant, Timeframe = SMART.
Let's break down the SMART acronym:
Is your objective specific?
Can you measure progress toward your goal?
Is the goal realistically attainable?
How relevant is the goal to your organization?
What is the timeframe for achieving this goal?
If you want to expand the SMART framework, you can make it SMARTER by adding evaluation and re-evaluating to your measurement steps. KPIs shouldn't be one-and-done—you should constantly evaluate your KPIs to ensure they are attainable and on track.
How to use KPIs with dashboard and reporting software
You might ask yourself, “Why do I need KPI software when I can use a spreadsheet?”
And while it’s true, spreadsheets have their limitations. Let’s look at the options for writing KPI dashboards or reports.
Spreadsheets are a great place to start if you’re new to KPI reporting. Spreadsheets offer limited data visualizations (pie charts, bar charts, etc) and there is a lot of time and manual effort required to get your report set up. Spreadsheets require regular, manual maintenance to keep your data up to date, The plus side of spreadsheets is that they are accessible to everyone.
Dashboard and reporting tools automate your data retrieval right from your data source, so right away, there is minimal manual effort. Dashboard and reporting tools often have data visualization customization and advanced capabilities, offering many visualization options. Lastly, while dashboard and reporting tools take some time to set up at the start, the result is that you and your team can buy back so much time because everything is automated.
BI and analytics software adds an additional layer of data capabilities on top of dashboard and reporting tools, often allowing for advanced analysis that meets the needs of sophisticated data and reporting teams.
XcelAxis lets you create real-time data visualizations of your KPIs. When tracking your KPIs, you’re likely pulling in data from different data sources, like HubSpot or Google Analytics. In an analytics tool, you can bring all that data together in just a few clicks, turn it into stunning data visualizations, and put them on a dashboard. From there, you can segment your data to look at channel types or countries, add dimensions, combine metrics and share customizable and insightful reports with your team
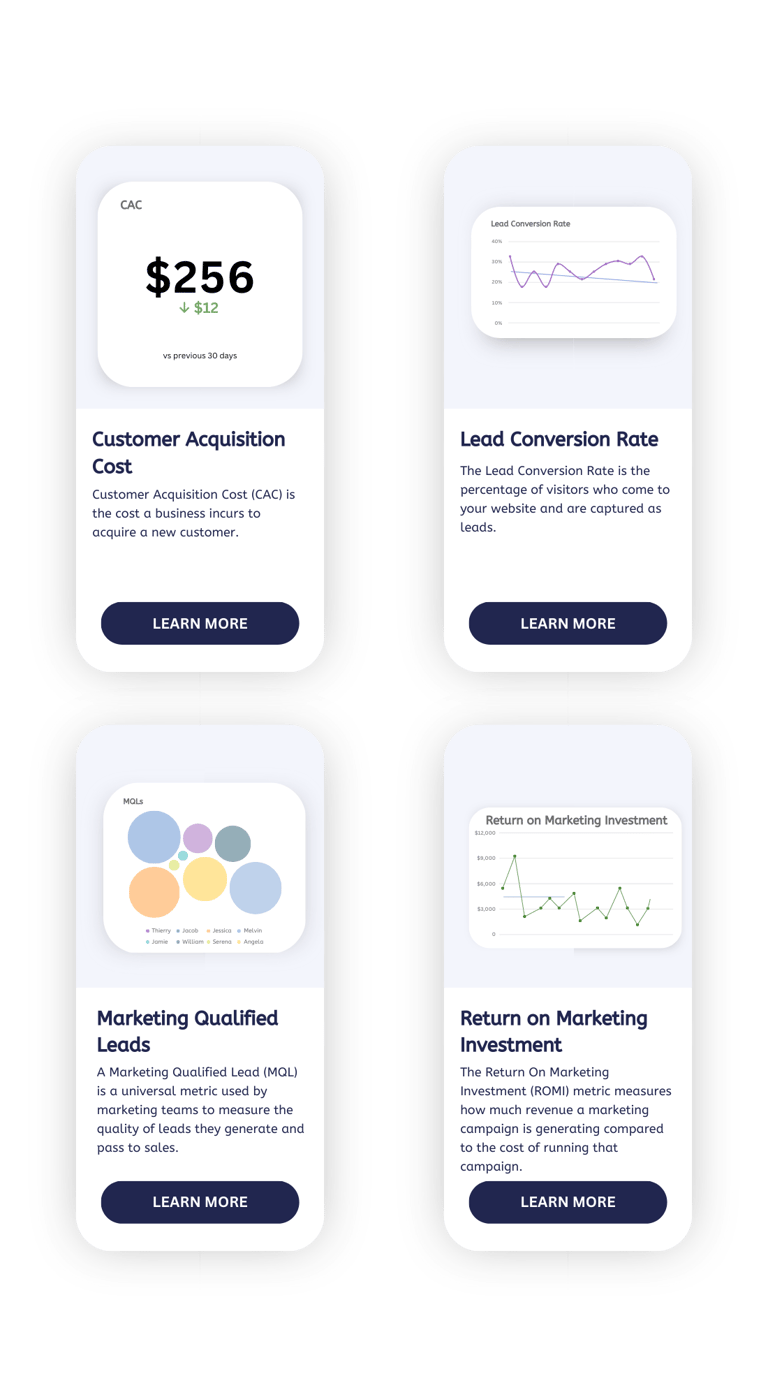
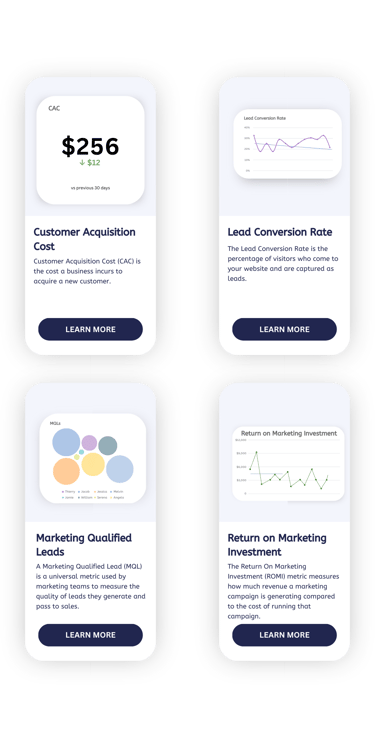
Best Marketing KPIs

Best Sales KPIs

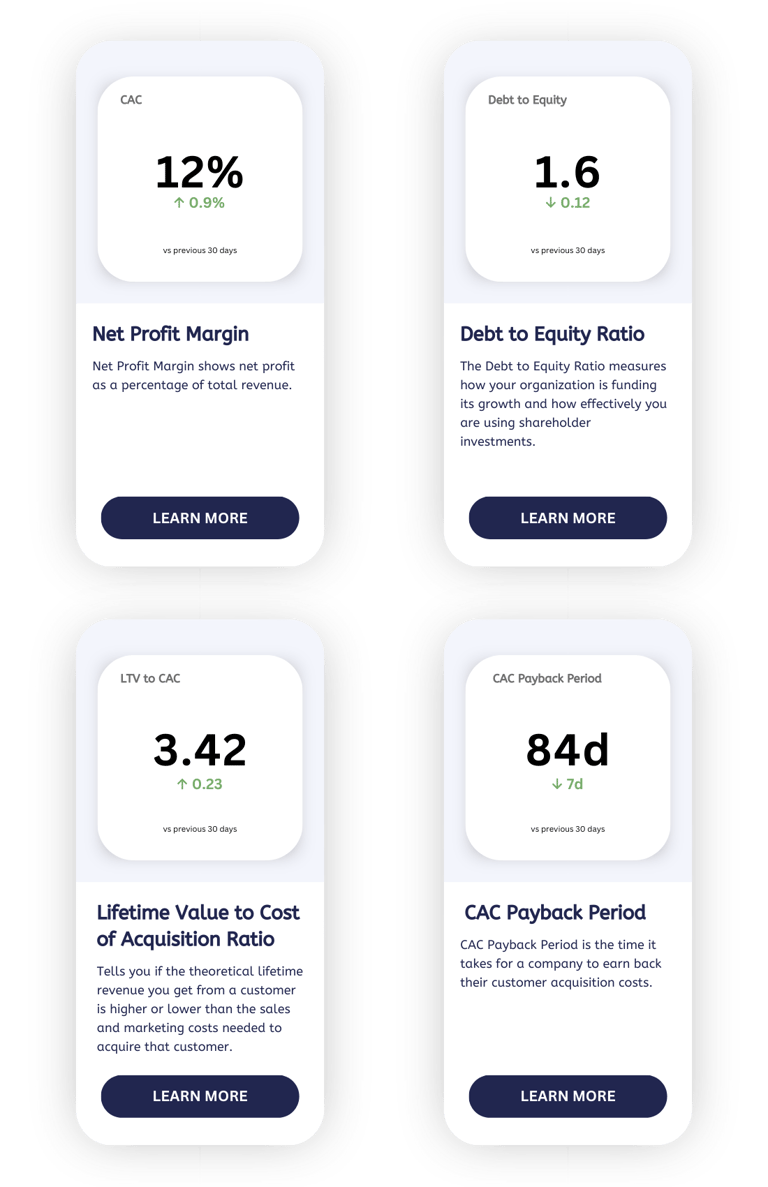
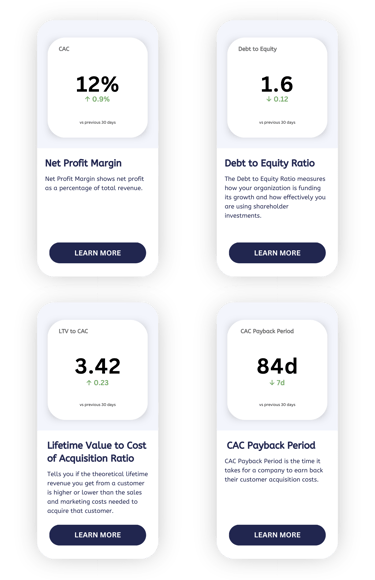
Best Finance KPIs
Resources
BI Analytics
Contact
Customer
Sitemap